
As you can notice, different materials behave differently to the applied force. Some might stretch and return to their original position, while some break quickly. Right? This behavior is very important for engineers and manufacturers to choose the right material. But have you wondered how they know a material’s stretchability? That’s where the guide on stress-strain curve comes handy. But if you are new to this term, it might feel technical to you. However, worry not! This guide on the stress-strain curve will help you. You will know what this curve is, how it is generated, and its real-world uses. So let’s get started.
What Is a Stress-Strain Curve?

A stress-strain curve is a simple graph that shows how a material responds when a force is applied. It basically shows the relationship between the stress acting on the material and the strain produced by that stress. Generally, this graph plots stress on the vertical (y) axis and strain on the horizontal (x) axis.
In simple terms, stress-strain graphs provide a clear picture of a material’s strength. It shows the extent to which material can withstand stress and when it eventually deforms. This information is very important. How? Actually, in engineering and manufacturing, every material has a different job. A material that must perform under heavy-duty conditions must be strong enough to withstand the stresses and loads.
This stress-strain curve basically measures the load-bearing behavior and capacity. Not only that, but this graph also helps determine toughness, stiffness, ductility, and elasticity at the same time. This saves the engineers and manufacturing from choosing the wrong material for a critical use.
How is the Stress-Strain Curve Generated? Step-by-Step
Remember, the stress-strain curve is not generated by guesswork. Instead, there is a complete test procedure known as a tensile test. During this test, force is applied carefully to help engineers measure how a material reacts. So let’s discuss step by step how this stress-strain curve is generated.
Step 1: Ready & Place the Specimen in the Testing Machine
The very first step in generating a stress-strain curve is specimen preparation. A specimen is basically a sample of the material about which you want information. It can be plastic, rubber, metal, or any other material. In its preparation, first you have to cut it into a specific shape and size according to standard testing rules.
Remember, if you don’t follow the cutting standards, the results will be inaccurate. But before cutting, you must note its original length and cross-sectional area, as they will be used later. Once your specimen is ready, place it inside a tensile testing machine. The machine has strong grips that hold the specimen firmly from both ends. So make sure you fix the specimen in these grips, and there is no movement or vibration.
Step 2: Apply Load & Measure Deformation
Once you have secured the sample inside the tensile tester, the actual test begins. The tensile testing machines pull the specimen from both ends at a slow, controlled rate. It applies the force gradually, not all at once. This gradual force helps you note every minor change in the specimen. First, when the force is a small amount, you might not notice any visible change.
But as the machine increases the force, changes occur in the sample’s length and shape. This is what we call deformation. Special sensors in the testing machine continuously measure the extent to which the specimen is stretching. The machine continuously measures both the load and the deformation throughout the test.
Step 3: Calculate Stress & Strain Values
You have now calculated the force and deformation data. Right? But these two raw measurements are not enough to describe the actual material behavior. That’s why next you have to calculate the stress and strain values from this data. How? Actually, stress indicates how much force is acting on a material. To calculate it, use the following formula.
Stress = Force ÷ Original Area
This calculation will show how much force is acting on each unit area of the material. A larger stress value means the material is experiencing a greater internal load. Now, after stress calculation, it’s time for strain calculation. Strain is basically how much a material stretches relative to its original length. For this, you can use the following formula.
Strain = Change in Length ÷ Original Length
Step 4: Plot the Data to Create the Curve
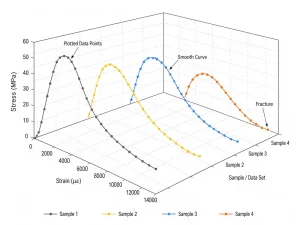
Now you have all the necessary calculations and information from the tensile stress. The final step is to place all those values on a graph. This is where the stress-strain curve is generated. Plot the strain values on the horizontal (x) axis and stress values on the vertical axis. Then each stress-strain pair is marked as a point. For example, if the stress is 20 MPa and the strain is 0.001, a point is placed at that location.
The same is done for all the other values. After plotting all the values, connect them with a smooth line. This line becomes the stress-strain curve. It will gradually show where the material was stiff or flexible, when permanent deformation began, and when it finally broke. Through this material behavior, engineers can know the actual strength and right usability of a material.
Main Regions of the Stress-Strain Curve
Now you have the basic know-how to create stress-strain graphs. Right? But next, you must also know how to read that graph. For this, different regions will help you understand it properly. So let’s discuss those stages on the stress-strain curve and know what they mean.
1- Elastic Region
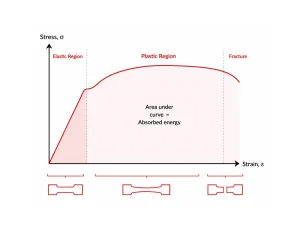
The first stage or region in the stress-strain curve is the elastic region. This is the point where the material just starts deforming but does not fully deform. Actually, as I said above, firstly, the machine applies a very low amount of force to the specimen. Here, the material begins to stretch, but this change is temporary. The material’s internal structure is only slightly disturbed. If you remove the force at any point within this region, the material will come to its original shape and size. It shows a material’s flexibility.
2- Yield Point
After the elastic region ends, the yield point starts at the stress-strain curve. This is the stage where material starts to deform permanently. Up to this point, if you remove the force, the material will regain its original shape. However, once the yield point is reached, the material begins to change shape permanently. Now, even if you remove the force, the material will not retain its original shape or size.
3- Plastic Region
The third region on the stress-strain curve is the plastic stage that comes just after the yield point. In this region, the material continues to stretch and deform as more force is applied. But that deformation is now permanent. It means the material can never return to its original position. Any change in the size, shape, or length of the material in this region will be permanent. The plastic region indicates the ultimate deformation limit of a material before it breaks.
4- Ultimate Tensile Strength (UTS)
Ultimate Tensile Strength (UTS) is the highest point on the stress-strain curve. It represents the maximum amount of stress a material can handle before it starts to weaken. At this stage, the material has reached its maximum stretch point, and it is very close to breaking. But still, it does not break. So this stage tells engineers the maximum load a material can withstand before it starts to fail internally. So they always ensure the material is never used near that UTS limit.
5- Fracture Point
Lastly, there is a fracture point on the stress-strain curve where the material actually breaks. At this point, the material has reached its maximum stretching limit. It can no longer handle the applied force and starts to thin. After that, it finally fractures and can no longer resist further force. This stage is primarily about the material’s strength. Some material might fracture without any warning signs, such as thinning. However, some might first stretch to their maximum limit, become thin, and then fracture.
Factors That Affect the Stress-Strain Curve
Remember, it is not always possible for stress-strain curves to remain the same under all conditions for all materials. Its shape and behavior can change depending on various factors. So before you deal with it, let’s discuss the factors that actually affect the stress-strain curve.
-
Material Type:
As you know, every material has a different tensile strength. It means each will react differently to the applied force. That’s why the curve also changes with this. For example, rubber stretches easily and shows a long curve before breaking. Steel, on the other hand, resists stretching more and shows a steeper curve. Likewise, brittle materials show almost no plastic region and break suddenly.
-
Temperature:
Temperature strongly affects how a material behaves. How? Actually, as the temperature rises, most materials become softer. Therefore, they become more easily deformed. In that case, they will stretch more under the same load, which changes the shape of the stress-strain curve. However, when the temperature decreases, materials often become harder. It means they will resist deformation but will break suddenly without stretching. All this also changes the stress-strain curve.
-
Strain Rate:
Strain rate refers to how fast a material is stretched or loaded. If the testing machine pulls the material slowly, it will have more time to adjust and deform. As a result, the curve shape will be sharp and different in this case. But if that strain rate is very high, the material might become brittle and show a different type of curve.
-
Heat Treatment:
You might have heard that, in many cases, materials are heat-treated. This is the process in which the workpiece is heated and rapidly cooled to change its internal structure. How this heat treatment is done will also affect the stress-strain curve. How? Suppose steel is heated but slowly cooled (annealing), it will become softer. So now it will not break quickly under force and show different curves. On the flip side, rapid cooling (quenching) can make it harder but more brittle. These changes directly alter the curve by shifting the yield point, fracture point, and strength.
Some Common Application Cases of Stress-Strain Curve
The stress-strain curve is not just a theoretical concept you see in the books. Instead, it has several real-world uses. It is the main part in engineering and manufacturing. For better understanding, let’s discuss where this curve is actually handy.
| Application Area | Use of Stress-Strain Curve |
| Construction (Buildings & Bridges) | Material selection |
| Automotive Industry | Crash safety and body design |
| Aerospace Engineering | Lightweight strength optimization |
| Machine Design | Part durability and load resistance |
| Civil Engineering Projects | Structural performance under load |
| Material Testing Labs | Comparing material properties |
| Medical Field | Safe implant design |
Conclusion
The behavior of each material in this world changes highly with the applied force. Some might withstand heavy force easily, while some break quickly. To understand this behavior, stress-strain curves come into the scene. It is a simple representation of how a material behaves under a specific applied force. In simple terms, it tells the material’s actual strength, deformation limit, and stretching capacity. When beginners know all this, they can make informed decisions about the material selection. That’s why this curve has become a necessity for designing safe buildings, strong machines, reliable vehicles, and so on.